
Kaman Reports 2012 First Quarter Results
 Neal Keating, President and Chief Executive Officer stated, “While below last year, our first quarter results were in line with our expectations and provide us confidence to reaffirm our outlook for the full year. This performance was led by another solid quarter for our Industrial Distribution business, which achieved record quarterly sales and operating profit. Our Aerospace results were lower than the prior year; however, we continue to experience strong order in-take, particularly for our bearing products.
Industrial Distribution sales rose 7.9% versus prior year and 9.6% when measured on a sales per sales day basis. Growth from our acquisitions outpaced organic growth which grew 3.3% on sales per sales day basis. We continue to focus on key initiatives aimed at increasing gross margin rates for this business, which resulted in record gross margin for the quarter, and our seventh consecutive quarter of year over year improvement.
Aerospace sales declined 5.7% primarily due to lower customer requirements on our BLACK HAWK programs, the lower volume of work under our Unmanned K-MAX Program and the timing and mix of various other programs across the segment. During the quarter we encountered JPF test failures that required us to suspend lot acceptance testing and fuze deliveries. Although this resulted in fewer than expected JPF shipments, we delivered more fuzes to the U.S. Government in this quarter than we did in the first quarter of the prior year. As we have indicated in the past, we anticipate JPF production interruptions will occur from time to time due to the difficulties associated with the extreme parameters of the acceptance tests and the sensitive nature of the production materials. We are working closely with our customer to review our findings and anticipate that we will receive approval to return to lot acceptance testing, on this important sole source program in early May. Despite these failures, we have been able continue production of fuze subassemblies, which will allow us to implement any required changes and return to acceptance testing quickly. In addition, we have more than adequate production and test capacity over the next several quarters to meet our plan for the year.
The performance of the two K-MAX aircraft deployed in Afghanistan has been outstanding. We are proud of the performance of the aircraft, which have maintained 95% flight availability and have now delivered over one million pounds of supplies to forward operating bases and combat outposts.
As we look ahead, we remain focused on a variety of growth opportunities and expect our performance to improve significantly through the balance of the year. We believe that our Industrial Distribution business will be a steady performer throughout the year and that we have built a platform for long-term growth. In our Aerospace business, start-up costs on our new programs will continue to provide some downside pressure on our near-term margins; however, we are confident that these new programs will provide significant contributions in the future. This year, we expect an acceleration of JPF shipments as we fulfill a strong backlog of orders, while continuing to benefit from increasing build rates for commercial aircraft and our participation on key military retrofit programs. Longer-term, we have opportunities to benefit from sales of SH-2G and K-MAX helicopters.”
Segment reports follow:
Industrial Distribution segment
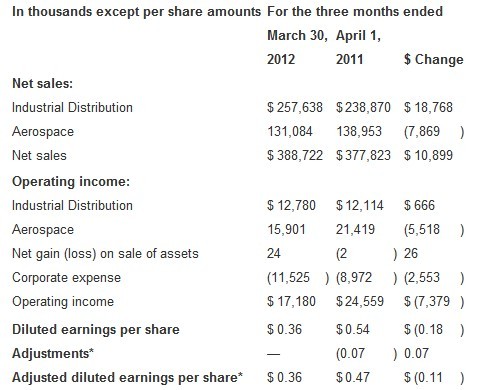
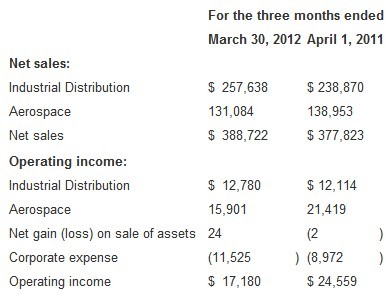
Sales increased 7.9% in the 2012 first quarter to $257.6 million compared to $238.9 million a year ago. Acquisitions contributed $14.6 million in sales in the quarter (sales from acquisitions are classified as organic beginning with the thirteenth month following the acquisition). On a sales per sales day* basis, sales increased 9.6% over last year's first quarter, with organic sales representing 3.3% of the increase. (See Table 3 for additional details regarding the Segment's sales per sales day performance.) Sales growth was driven by increases in machinery manufacturing, durable goods, mining, and primary metal manufacturing, offset by declines in sales volume in the food, beverage and paper manufacturing industries.
Segment operating income for the first quarter of 2012 was $12.8 million compared to operating income of $12.1 million in the first quarter of 2011. The operating profit margin for the first quarter of 2012 was 5.0%. In comparison, the operating profit margin was 4.8% in the fourth quarter of 2011 and 5.1% in the first quarter of 2011. Operating profit was higher year over year as a result of higher sales volume and increased gross profit, which reached a record level in the quarter. Operating margin for 2012 was impacted by significantly higher pension and employee medical expenses.
Aerospace segment
Sales were $131.1 million, a decrease of $7.9 million from sales of $139.0 million in the first quarter of 2011. During the first quarter of 2012 the segment experienced lower sales from a variety of programs. These lower sales were a result of expected fluctuations in mix and timing of deliveries. Programs generating lower sales were Unmanned K-MAX, BLACK HAWK fuselage joining and installation, BLACK HAWK cockpit production, C-17, certain missile fuze programs and the direct commercial sales of the Joint Programmable Fuze. These reductions were somewhat offset by strong performance from bearing product lines, increased shipments of the JPF to the U.S. Government, the Egyptian SH-2G(E) maintenance and upgrade program, and contributions from the acquisition of Vermont Composites.
Operating income for the first quarter of 2012 was $15.9 million, compared to operating income of $21.4 million in the 2011 first quarter. The operating margin in this year's first quarter was 12.1% as compared to 15.4% in the comparable period in the prior year. The lower sales volume on our Unmanned K-MAX program, the customer-driven volume reductions under our Sikorsky BLACK HAWK programs and the timing of deliveries under our legacy fuze programs accounted for approximately $6.5 million of the operating profit reduction when compared to the first quarter of the prior year. The operating profit margin was also impacted by higher employee medical expenses.
Other
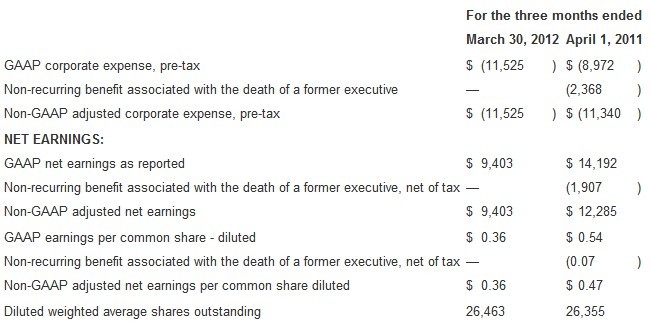
First quarter 2011 results include a non-recurring benefit of $2.4 million or $0.07 per diluted share related to the death of a former executive.
Outlook
The Company's expectations for 2012 are reaffirmed as follows:
•Aerospace segment sales of $605 million to $625 million, up 11% to 14% over 2011
•Aerospace segment operating margin of 15.7% to 16.0%
•Industrial Distribution segment sales of $1,025 million to $1,055 million, up 8% to 11% over 2011
•Industrial Distribution segment operating margin of 5.4% to 5.6%
•Interest expense of approximately $13.5 million
•Corporate expenses of approximately $44 million to $46 million
•Tax rate of approximately 35%
•Free cash flow* of $30 million to $35 million
Chief Financial Officer, William C. Denninger, commented, "Overall, our earnings were lower than the first quarter of the prior year due to the sales mix and timing of deliveries within Aerospace and higher employee medical expenses. We experienced solid performance from Industrial Distribution and strong performance from our bearing product lines, which are benefiting from increasing commercial build rates. We received $156 million in new Aerospace orders during the quarter, bringing our backlog to $557 million and providing us confidence in our outlook for the year."
Please see the MD&A section of the Company's SEC Form 10-Q filed concurrent with the issuance of this release for greater detail on our results and various company programs.
A conference call has been scheduled for tomorrow, May 1, 2012 at 8:30 AM EDT. Listeners may access the call live over the Internet through a link on the home page of the Company's website at . In its discussion, management may include certain non-GAAP measures related to company performance. If so, a reconciliation of that information to GAAP, if not provided in this release, will be provided in the exhibits to the conference call and will be available through the Internet link provided above.
Table 2. Summary of Segment
Information (in thousands)
Neal Keating, President and Chief Executive Officer stated, “While below last year, our first quarter results were in line with our expectations and provide us confidence to reaffirm our outlook for the full year. This performance was led by another solid quarter for our Industrial Distribution business, which achieved record quarterly sales and operating profit. Our Aerospace results were lower than the prior year; however, we continue to experience strong order in-take, particularly for our bearing products.
Industrial Distribution sales rose 7.9% versus prior year and 9.6% when measured on a sales per sales day basis. Growth from our acquisitions outpaced organic growth which grew 3.3% on sales per sales day basis. We continue to focus on key initiatives aimed at increasing gross margin rates for this business, which resulted in record gross margin for the quarter, and our seventh consecutive quarter of year over year improvement.
Aerospace sales declined 5.7% primarily due to lower customer requirements on our BLACK HAWK programs, the lower volume of work under our Unmanned K-MAX Program and the timing and mix of various other programs across the segment. During the quarter we encountered JPF test failures that required us to suspend lot acceptance testing and fuze deliveries. Although this resulted in fewer than expected JPF shipments, we delivered more fuzes to the U.S. Government in this quarter than we did in the first quarter of the prior year. As we have indicated in the past, we anticipate JPF production interruptions will occur from time to time due to the difficulties associated with the extreme parameters of the acceptance tests and the sensitive nature of the production materials. We are working closely with our customer to review our findings and anticipate that we will receive approval to return to lot acceptance testing, on this important sole source program in early May. Despite these failures, we have been able continue production of fuze subassemblies, which will allow us to implement any required changes and return to acceptance testing quickly. In addition, we have more than adequate production and test capacity over the next several quarters to meet our plan for the year.
The performance of the two K-MAX aircraft deployed in Afghanistan has been outstanding. We are proud of the performance of the aircraft, which have maintained 95% flight availability and have now delivered over one million pounds of supplies to forward operating bases and combat outposts.
As we look ahead, we remain focused on a variety of growth opportunities and expect our performance to improve significantly through the balance of the year. We believe that our Industrial Distribution business will be a steady performer throughout the year and that we have built a platform for long-term growth. In our Aerospace business, start-up costs on our new programs will continue to provide some downside pressure on our near-term margins; however, we are confident that these new programs will provide significant contributions in the future. This year, we expect an acceleration of JPF shipments as we fulfill a strong backlog of orders, while continuing to benefit from increasing build rates for commercial aircraft and our participation on key military retrofit programs. Longer-term, we have opportunities to benefit from sales of SH-2G and K-MAX helicopters.”
Segment reports follow:
Industrial Distribution segment
Sales increased 7.9% in the 2012 first quarter to $257.6 million compared to $238.9 million a year ago. Acquisitions contributed $14.6 million in sales in the quarter (sales from acquisitions are classified as organic beginning with the thirteenth month following the acquisition). On a sales per sales day* basis, sales increased 9.6% over last year's first quarter, with organic sales representing 3.3% of the increase. (See Table 3 for additional details regarding the Segment's sales per sales day performance.) Sales growth was driven by increases in machinery manufacturing, durable goods, mining, and primary metal manufacturing, offset by declines in sales volume in the food, beverage and paper manufacturing industries.
Segment operating income for the first quarter of 2012 was $12.8 million compared to operating income of $12.1 million in the first quarter of 2011. The operating profit margin for the first quarter of 2012 was 5.0%. In comparison, the operating profit margin was 4.8% in the fourth quarter of 2011 and 5.1% in the first quarter of 2011. Operating profit was higher year over year as a result of higher sales volume and increased gross profit, which reached a record level in the quarter. Operating margin for 2012 was impacted by significantly higher pension and employee medical expenses.
Aerospace segment
Sales were $131.1 million, a decrease of $7.9 million from sales of $139.0 million in the first quarter of 2011. During the first quarter of 2012 the segment experienced lower sales from a variety of programs. These lower sales were a result of expected fluctuations in mix and timing of deliveries. Programs generating lower sales were Unmanned K-MAX, BLACK HAWK fuselage joining and installation, BLACK HAWK cockpit production, C-17, certain missile fuze programs and the direct commercial sales of the Joint Programmable Fuze. These reductions were somewhat offset by strong performance from bearing product lines, increased shipments of the JPF to the U.S. Government, the Egyptian SH-2G(E) maintenance and upgrade program, and contributions from the acquisition of Vermont Composites.
Operating income for the first quarter of 2012 was $15.9 million, compared to operating income of $21.4 million in the 2011 first quarter. The operating margin in this year's first quarter was 12.1% as compared to 15.4% in the comparable period in the prior year. The lower sales volume on our Unmanned K-MAX program, the customer-driven volume reductions under our Sikorsky BLACK HAWK programs and the timing of deliveries under our legacy fuze programs accounted for approximately $6.5 million of the operating profit reduction when compared to the first quarter of the prior year. The operating profit margin was also impacted by higher employee medical expenses.
Other
First quarter 2011 results include a non-recurring benefit of $2.4 million or $0.07 per diluted share related to the death of a former executive.
Outlook
The Company's expectations for 2012 are reaffirmed as follows:
•Aerospace segment sales of $605 million to $625 million, up 11% to 14% over 2011
•Aerospace segment operating margin of 15.7% to 16.0%
•Industrial Distribution segment sales of $1,025 million to $1,055 million, up 8% to 11% over 2011
•Industrial Distribution segment operating margin of 5.4% to 5.6%
•Interest expense of approximately $13.5 million
•Corporate expenses of approximately $44 million to $46 million
•Tax rate of approximately 35%
•Free cash flow* of $30 million to $35 million
Chief Financial Officer, William C. Denninger, commented, "Overall, our earnings were lower than the first quarter of the prior year due to the sales mix and timing of deliveries within Aerospace and higher employee medical expenses. We experienced solid performance from Industrial Distribution and strong performance from our bearing product lines, which are benefiting from increasing commercial build rates. We received $156 million in new Aerospace orders during the quarter, bringing our backlog to $557 million and providing us confidence in our outlook for the year."
Please see the MD&A section of the Company's SEC Form 10-Q filed concurrent with the issuance of this release for greater detail on our results and various company programs.
A conference call has been scheduled for tomorrow, May 1, 2012 at 8:30 AM EDT. Listeners may access the call live over the Internet through a link on the home page of the Company's website at . In its discussion, management may include certain non-GAAP measures related to company performance. If so, a reconciliation of that information to GAAP, if not provided in this release, will be provided in the exhibits to the conference call and will be available through the Internet link provided above.
Table 2. Summary of Segment
Information (in thousands)
 Non-GAAP Measure Disclosure
Management believes that the non-GAAP (Generally Accepted Accounting Principles) measures indicated by an asterisk (*) used in this release or in other disclosures provide investors with important perspectives into the Company's ongoing business performance. The Company does not intend for the information to be considered in isolation or as a substitute for the related GAAP measures. Other companies may define the measures differently. We define the non-GAAP measures used in this report and other disclosures, as follows:
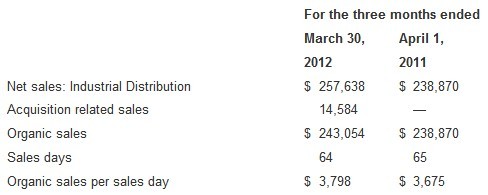
Organic Sales per Sales Day - Organic sales per sales day is defined as GAAP “Net sales from the Industrial Distribution segment” less sales derived from acquisitions, divided by the number of sales days in a given period. Sales days are essentially business days that the Company's branch locations are open for business and exclude weekends and holidays. Sales days are provided as part of this release. Management believes organic sales per sales day provides investors with an important perspective on how net sales may be impacted by the number of days the segment is open for business.
Management uses organic sales per sales day as a measurement to compare periods in which the number of sales days differ. The following table illustrates the calculation of organic sales per sales day using “Net sales: Industrial Distribution” from the “Segment and Geographic Information” footnote in the “Notes to Condensed Consolidated Financial Statements” from the Company's Form 10-Q filed with the Securities and Exchange Commission on April 30, 2012. Sales from acquisitions are classified as organic beginning with the thirteenth month following the acquisition.
Table 3. Industrial Distribution - Organic Sales
Per Sales Day (in thousands, except days)
Non-GAAP Measure Disclosure
Management believes that the non-GAAP (Generally Accepted Accounting Principles) measures indicated by an asterisk (*) used in this release or in other disclosures provide investors with important perspectives into the Company's ongoing business performance. The Company does not intend for the information to be considered in isolation or as a substitute for the related GAAP measures. Other companies may define the measures differently. We define the non-GAAP measures used in this report and other disclosures, as follows:
Organic Sales per Sales Day - Organic sales per sales day is defined as GAAP “Net sales from the Industrial Distribution segment” less sales derived from acquisitions, divided by the number of sales days in a given period. Sales days are essentially business days that the Company's branch locations are open for business and exclude weekends and holidays. Sales days are provided as part of this release. Management believes organic sales per sales day provides investors with an important perspective on how net sales may be impacted by the number of days the segment is open for business.
Management uses organic sales per sales day as a measurement to compare periods in which the number of sales days differ. The following table illustrates the calculation of organic sales per sales day using “Net sales: Industrial Distribution” from the “Segment and Geographic Information” footnote in the “Notes to Condensed Consolidated Financial Statements” from the Company's Form 10-Q filed with the Securities and Exchange Commission on April 30, 2012. Sales from acquisitions are classified as organic beginning with the thirteenth month following the acquisition.
Table 3. Industrial Distribution - Organic Sales
Per Sales Day (in thousands, except days)
 Free Cash Flow - Free cash flow is defined as GAAP “Net cash provided by (used in) operating activities” less “Expenditures for property, plant & equipment.” Management believes free cash flow provides investors with an important perspective on the cash available for dividends to shareholders, debt repayment, and acquisitions after making capital investments required to support ongoing business operations and long-term value creation. Free cash flow does not represent the residual cash flow available for discretionary expenditures as it excludes certain mandatory expenditures such as repayment of maturing debt. Management uses free cash flow internally to assess both business performance and overall liquidity. The following table illustrates the calculation of free cash flow using “Net cash provided by (used in) operating activities” and “Expenditures for property, plant & equipment”, GAAP measures from the Condensed Consolidated Statements of Cash Flows included in this release.
Table 4. Free Cash Flow (in thousands)
Free Cash Flow - Free cash flow is defined as GAAP “Net cash provided by (used in) operating activities” less “Expenditures for property, plant & equipment.” Management believes free cash flow provides investors with an important perspective on the cash available for dividends to shareholders, debt repayment, and acquisitions after making capital investments required to support ongoing business operations and long-term value creation. Free cash flow does not represent the residual cash flow available for discretionary expenditures as it excludes certain mandatory expenditures such as repayment of maturing debt. Management uses free cash flow internally to assess both business performance and overall liquidity. The following table illustrates the calculation of free cash flow using “Net cash provided by (used in) operating activities” and “Expenditures for property, plant & equipment”, GAAP measures from the Condensed Consolidated Statements of Cash Flows included in this release.
Table 4. Free Cash Flow (in thousands)
 Debt to Capitalization Ratio - Debt to capitalization ratio is calculated by dividing debt by capitalization. Debt is defined as GAAP “Notes payable” plus “Current portion of long-term debt” plus “Long-term debt, excluding current portion.” Capitalization is defined as Debt plus GAAP “Total shareholders' equity.” Management believes that debt to capitalization is a measurement of financial leverage and provides investors with an insight into the financial structure of the Company and its financial strength. The following table illustrates the calculation of debt to capitalization using GAAP measures from the condensed consolidated balance sheets included in this release.
Table 5. Debt to Capitalization (in thousands)
Debt to Capitalization Ratio - Debt to capitalization ratio is calculated by dividing debt by capitalization. Debt is defined as GAAP “Notes payable” plus “Current portion of long-term debt” plus “Long-term debt, excluding current portion.” Capitalization is defined as Debt plus GAAP “Total shareholders' equity.” Management believes that debt to capitalization is a measurement of financial leverage and provides investors with an insight into the financial structure of the Company and its financial strength. The following table illustrates the calculation of debt to capitalization using GAAP measures from the condensed consolidated balance sheets included in this release.
Table 5. Debt to Capitalization (in thousands)
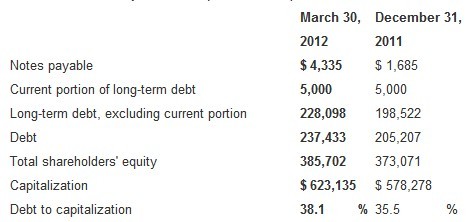 Table 6. Reconciliation of Non-GAAP Financial Information
(In thousands except per share amounts)
Table 6. Reconciliation of Non-GAAP Financial Information
(In thousands except per share amounts)
 About Kaman Corporation
Kaman Corporation, founded in 1945 by aviation pioneer Charles H. Kaman, and headquartered in Bloomfield, Connecticut conducts business in the aerospace and industrial distribution markets. The company produces and/or markets widely used proprietary aircraft bearings and components; complex metallic and composite aerostructures for commercial, military and general aviation fixed and rotary wing aircraft; aerostructure engineering design analysis and FAA certification services; safe and arm solutions for missile and bomb systems for the U.S. and allied militaries; subcontract helicopter work; and support for the company's SH-2G Super Seasprite maritime helicopters and K-MAX medium-to-heavy lift helicopters. The company is a leading distributor of industrial parts, and operates more than 200 customer service centers and five distribution centers across North America. Kaman offers more than four million items including bearings, mechanical power transmission, electrical, material handling, motion control, fluid power, automation and MRO supplies to customers in virtually every industry. Additionally, Kaman provides engineering, design and support for automation, electrical, linear, hydraulic and pneumatic systems as well as belting and rubber fabrication, customized mechanical services, hose assemblies, repair, fluid analysis and motor management.
About Kaman Corporation
Kaman Corporation, founded in 1945 by aviation pioneer Charles H. Kaman, and headquartered in Bloomfield, Connecticut conducts business in the aerospace and industrial distribution markets. The company produces and/or markets widely used proprietary aircraft bearings and components; complex metallic and composite aerostructures for commercial, military and general aviation fixed and rotary wing aircraft; aerostructure engineering design analysis and FAA certification services; safe and arm solutions for missile and bomb systems for the U.S. and allied militaries; subcontract helicopter work; and support for the company's SH-2G Super Seasprite maritime helicopters and K-MAX medium-to-heavy lift helicopters. The company is a leading distributor of industrial parts, and operates more than 200 customer service centers and five distribution centers across North America. Kaman offers more than four million items including bearings, mechanical power transmission, electrical, material handling, motion control, fluid power, automation and MRO supplies to customers in virtually every industry. Additionally, Kaman provides engineering, design and support for automation, electrical, linear, hydraulic and pneumatic systems as well as belting and rubber fabrication, customized mechanical services, hose assemblies, repair, fluid analysis and motor management.
1.The news above mentioned with detailed source are from internet.We are trying our best to assure they are accurate ,timely and safe so as to let bearing users and sellers read more related info.However, it doesn't mean we agree with any point of view referred in above contents and we are not responsible for the authenticity. If you want to publish the news,please note the source and you will be legally responsible for the news published.
2.All news edited and translated by us are specially noted the source"CBCC".
3.For investors,please be cautious for all news.We don't bear any damage brought by late and inaccurate news.
4.If the news we published involves copyright of yours,just let us know.


Next New RKB technical conference in Northern Italy
BRIEF INTRODUCTION
Cnbearing is the No.1 bearing inquiry system and information service in China, dedicated to helping all bearing users and sellers throughout the world.
Cnbearing is supported by China National Bearing Industry Association, whose operation online is charged by China Bearing Unisun Tech. Co., Ltd.
China Bearing Unisun Tech. Co., Ltd owns all the rights. Since 2000, over 3,000 companies have been registered and enjoyed the company' s complete skillful service, which ranking many aspects in bearing industry at home and abroad with the most authority practical devices in China.